

A Technology Execution Scorecard by QuantDig
In today’s technology landscape, every company claims to be innovative, AI-driven, and enterprise-ready. Roadmaps are polished, presentations are convincing, and buzzwords are everywhere.
But when systems hit production, traffic spikes, incidents occur, or deadlines tighten, a more important question emerges:
Can this company actually deliver?
At QuantDig, we believe technology credibility is not defined by what a company promises, but by how consistently it executes. This article introduces the Technology Execution Scorecard — a structured framework to assess whether a company can reliably turn ideas into stable, secure, and scalable production systems.
Why Execution Matters More Than Vision
Vision is easy. Execution is hard.
Technology execution determines:
- Whether features ship on time
- Whether systems remain stable under pressure
- Whether teams recover quickly from failures
- Whether security and compliance are embedded or improvised
Execution capability is what separates demo-grade systems from production-grade platforms.
The QuantDig Technology Execution Scorecard
The QuantDig Execution Scorecard evaluates companies across eight critical dimensions that together reflect real-world delivery strength.
Each dimension is scored independently, allowing objective comparison across organizations.
1. Talent & Engineering Depth
Strong execution begins with people.
This dimension evaluates:
- Depth of senior engineering talent
- Ownership of critical systems
- Ability to design, refactor, and maintain complex platforms
- Dependency on external vendors for core capabilities
Organizations with shallow expertise may ship fast initially but struggle to sustain systems over time.
2. Delivery Velocity
Speed is not about rushing — it’s about predictability.
We assess:
- Release frequency
- Lead time from code commit to production
- Deployment automation
- Confidence in rollbacks and hotfixes
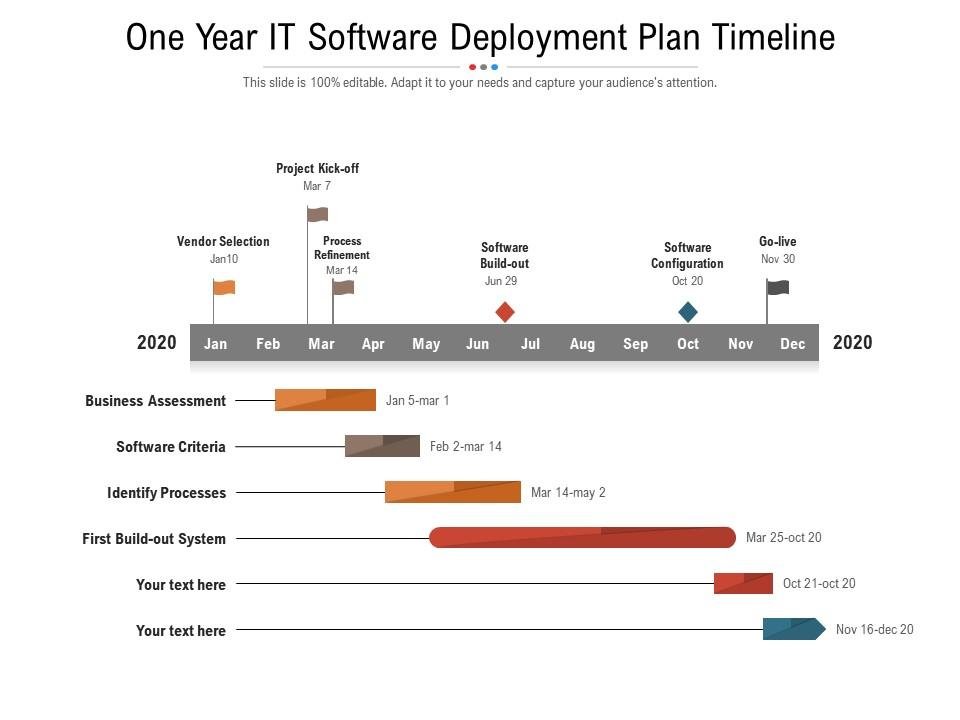
High-performing teams deliver frequently without destabilizing production.
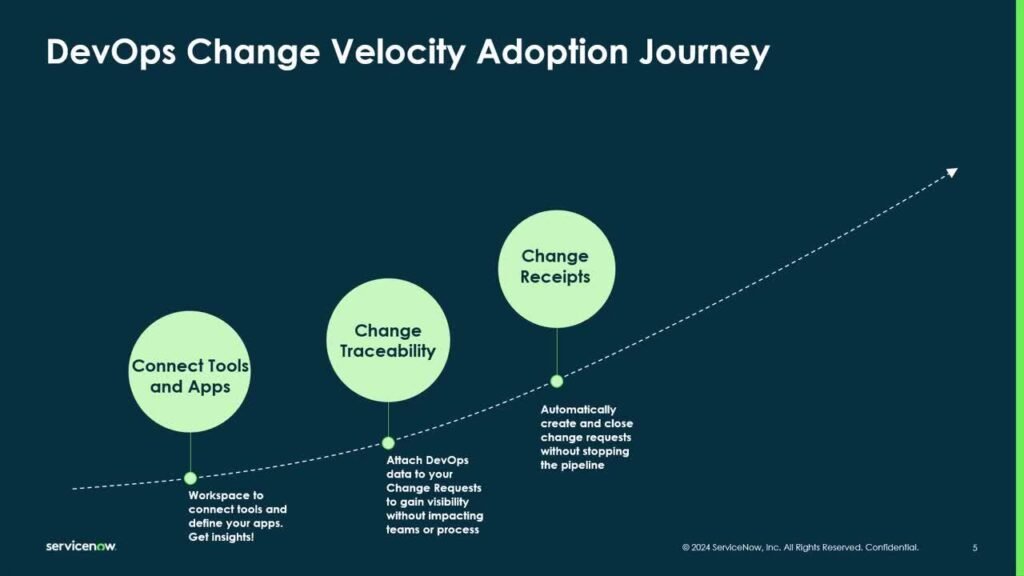
3. DevOps & CI/CD Maturity
DevOps is not a toolchain; it’s an operating model.
This dimension examines:
- CI/CD pipeline depth and automation
- Quality gates (code quality, security, compliance)
- Environment parity across Dev, Test, and Prod
- Infrastructure as Code adoption
Superficial pipelines indicate cosmetic DevOps. Mature pipelines indicate delivery discipline.
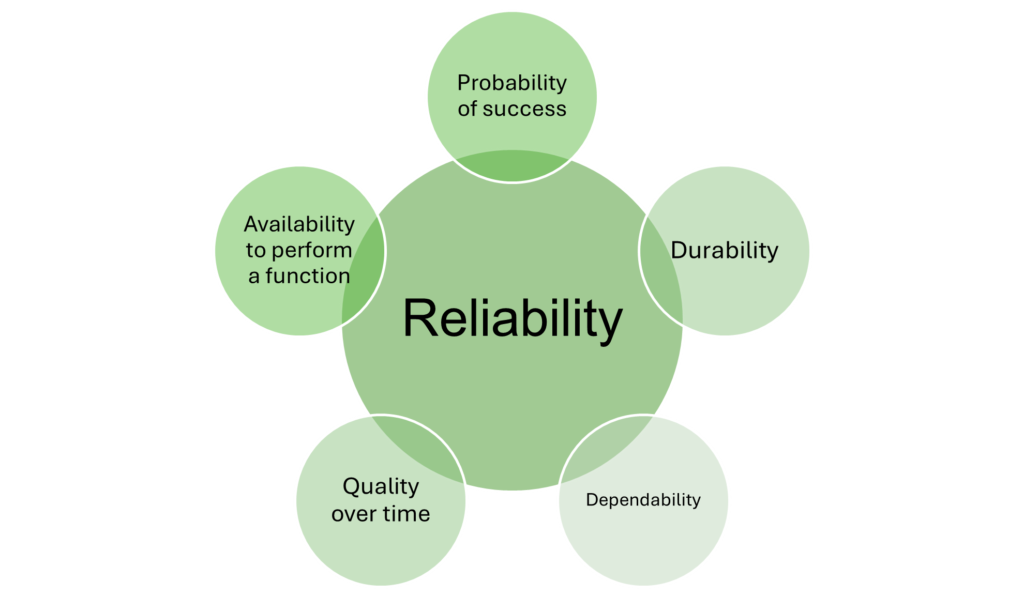
4. Production Reliability
Production is where truth reveals itself.
Key indicators include:
- System uptime consistency
- Incident frequency
- Mean Time To Recovery (MTTR)
- Fault tolerance and graceful degradation
Reliable systems are designed to fail safely — not collapse unexpectedly.
5. Observability & Monitoring

You cannot fix what you cannot see.
This area evaluates:
- Logging, metrics, and tracing coverage
- Proactive alerting versus reactive firefighting
- Root-cause analysis practices
- Data-driven incident resolution
Organizations with strong observability detect problems before customers do.
6. Security by Design
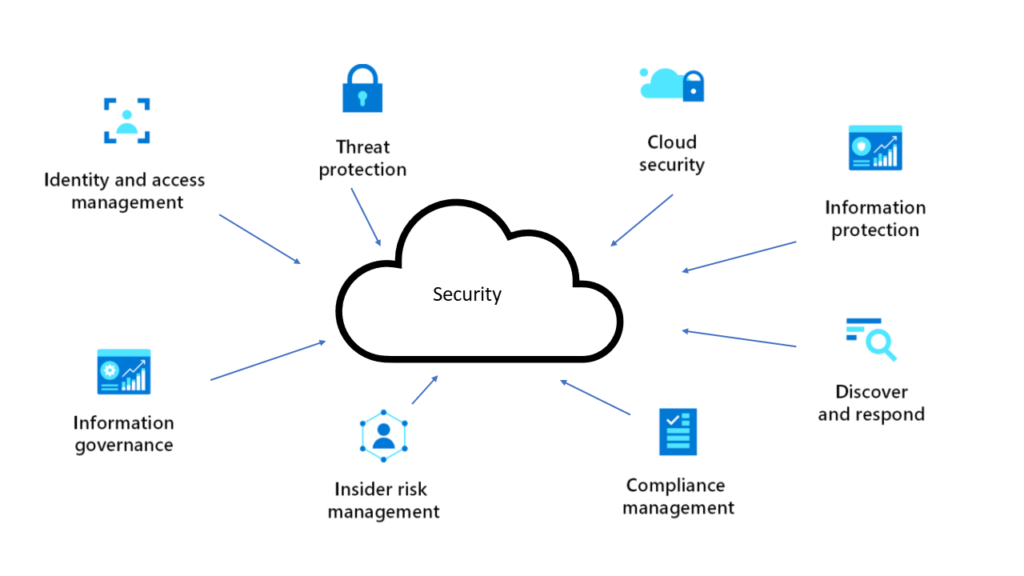
Security must be engineered, not added later.
We look at:
- Secrets and key management practices
- Supply chain security controls
- Runtime protection mechanisms
- Audit and compliance readiness
Security maturity reflects how seriously a company treats long-term risk.
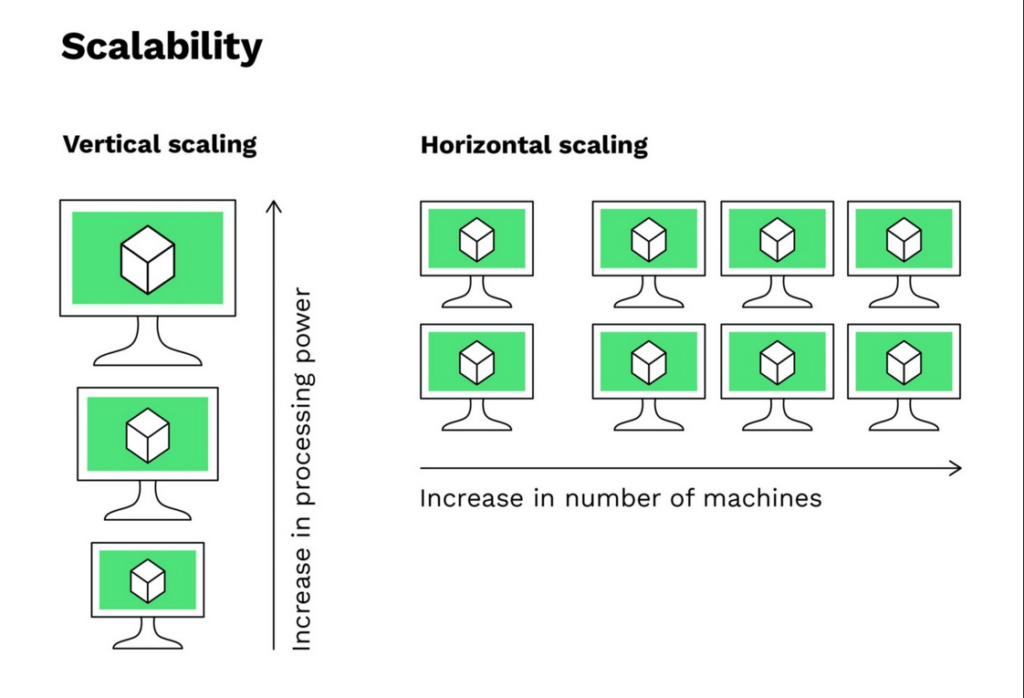
7. Scalability & Future Readiness

Systems must grow without redesigning everything.
This dimension includes:
- Horizontal scalability
- Stateless service design
- Cloud and container readiness
- Data growth and performance handling
Future-ready systems absorb growth; brittle systems resist it.
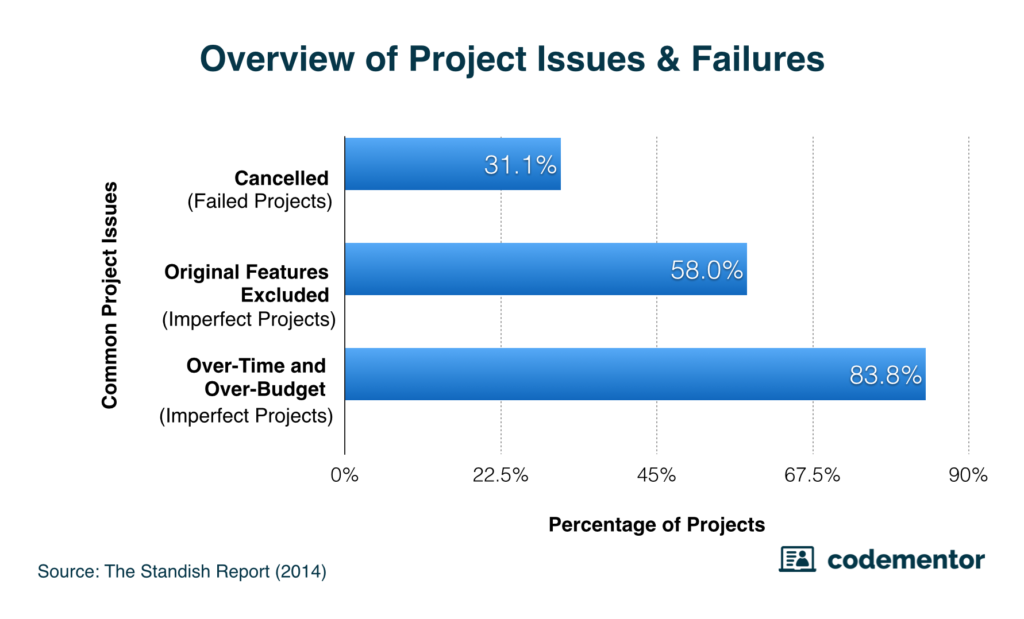
8. Execution Track Record
Past execution is the strongest predictor of future delivery.
We assess:
- History of missed deadlines
- Failed migrations or rewrites
- Abandoned platforms
- Publicly visible delivery failures
Consistent execution builds trust. Repeated failures erode it.
QuantDig Execution Scoring Model
Each dimension is scored on a 0–5 scale, where:
- 0–1: Weak / high risk
- 2–3: Adequate but inconsistent
- 4–5: Strong, repeatable execution
The final Technology Execution Score represents an organization’s real delivery capability.
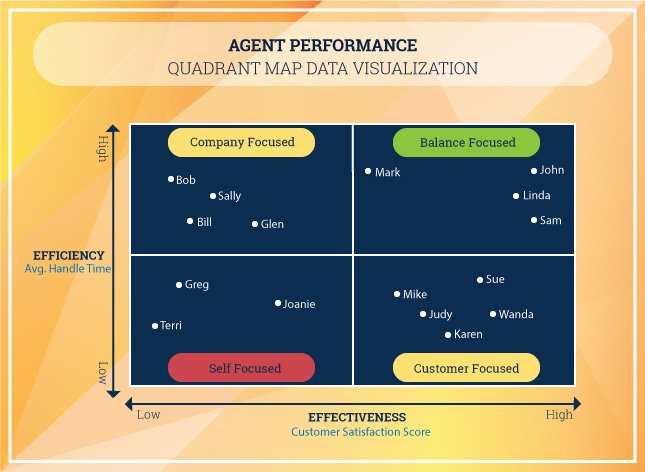
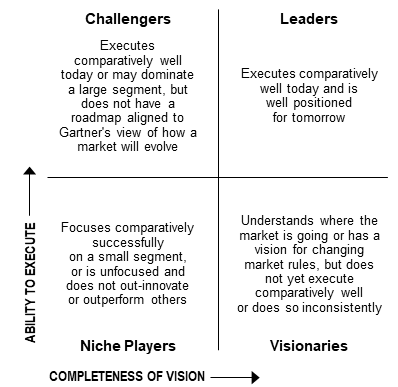
Execution-Based Classification
Based on the overall score, QuantDig classifies companies into four execution tiers:
- Execution Leaders – Consistent, resilient, production-grade delivery
- Capable but Risky – Strong potential with visible execution gaps
- Over-Promising – Strong narratives, weak delivery discipline
- Execution-Debt Heavy – High risk, unstable foundations
This classification allows decision-makers to look beyond branding and focus on operational reality.
Why This Matters for Buyers, Leaders, and Engineers
The Technology Execution Scorecard helps:
- CTOs evaluate vendors and partners
- Enterprises reduce delivery risk
- Engineering leaders benchmark maturity
- Investors identify operational strength beyond hype
Execution capability determines cost, stability, security, and trust.
The QuantDig Perspective
Technology success is not about tools, frameworks, or trends.
It is about repeatable execution under real-world constraints.
At QuantDig, we analyze companies through this execution-first lens — because in production, delivery is the only truth that matters.